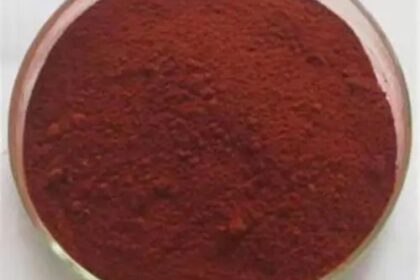
As a commonly used iron supplement, the thermal stability of ferrous gluconate directly affects its production, storage, and application safety. Thermal decomposition kinetics research serves as a core approach to reveal its thermal decomposition mechanism and evaluate its thermal stability. By accurately capturing the mass change, energy variation, and product evolution patterns during the thermal decomposition process, and deriving key parameters in combination with kinetic models, this research provides theoretical support for process optimization (e.g., drying temperature control) in practical production and the formulation of storage conditions (e.g., temperature and humidity management).
I. Stage Division and Characteristics of the Thermal Decomposition Process
The thermal decomposition of ferrous gluconate is not a single process but exhibits a multi-stage progressive characteristic with increasing temperature. The reaction type, mass loss, and products of each stage differ significantly, and it can usually be divided into 3–4 core stages:
1. Low-Temperature Dehydration Stage
This stage generally occurs within the temperature range of 50–150°C, with the main reaction being the removal of crystalline water and adsorbed water from ferrous gluconate crystals. The mass loss ratio at this stage is typically 8%–12%, corresponding to a gentle endothermic peak in the Differential Thermal Analysis (DTA) curve. Since energy is required for water molecules to detach from the crystal lattice, but the intermolecular forces are weak, the peak shape is broad and the endothermic intensity is low. The product is anhydrous ferrous gluconate, which still maintains its original salt structure without chemical bond breakage.
2. Organic Ligand Degradation Stage
When the temperature rises to 150–300°C, the second stage begins, with the core being the gradual degradation of gluconate anions (C₆H₁₁O₇⁻). This is the main mass loss stage of thermal decomposition, with a mass loss ratio of up to 60%–70%. The DTA curve shows multiple overlapping strong endothermic peaks (or accompanied by weak exothermic peaks), resulting from the sequential breakage of hydroxyl groups, carboxyl groups, and carbon-carbon bonds in gluconate, generating volatile products such as CO₂, H₂O, small-molecule organic acids (e.g., acetic acid, propionic acid), and hydrocarbons. The product system is a mixture of iron-containing oxide precursors (e.g., ferrous hydroxide, basic iron salts) and carbon residues.
3. Inorganic Iron Compound Transformation Stage
When the temperature exceeds 300°C (usually 300–500°C), the iron-containing intermediates generated in the previous stage begin to undergo oxidation and crystal form transformation. If oxygen is present in the system, low-valent iron (Fe²⁺) will be oxidized to high-valent iron (Fe³⁺), gradually converting into iron oxides (e.g., Fe₂O₃, Fe₃O₄); in an inert atmosphere (e.g., nitrogen), FeO or iron carbides may be formed. The mass loss ratio at this stage is approximately 5%–10% (mainly due to the combustion or decomposition of residual organic carbon), and a sharp endothermic or exothermic peak appears in the DTA curve, corresponding to the energy change of crystal form reconstruction of iron compounds or oxidation reactions. The final product in an air atmosphere is mostly α-Fe₂O₃ (hematite), whose phase can be verified by X-ray Diffraction (XRD).
II. Core Methods of Thermal Decomposition Kinetics Research
Currently, thermal decomposition kinetics research on ferrous gluconate mainly relies on thermal analysis techniques, which provide basic data for kinetic calculations by real-time monitoring of physical property changes during the thermal decomposition process. Common methods include:
1. Thermogravimetric Analysis (TGA)
As the most core testing method, TGA accurately records the mass change curve (TGA curve) of the sample with temperature (or time) at different heating rates (e.g., 5°C/min, 10°C/min, 20°C/min), obtaining the mass loss rate, initial decomposition temperature (T₀), peak decomposition temperature (Tₚ), and final decomposition temperature (T_f) of each decomposition stage. The derivative curve (DTG) of the TGA curve can further identify the temperature corresponding to the maximum decomposition rate of each stage, providing a basis for dividing reaction stages and selecting kinetic calculation intervals.
2. Differential Thermal Analysis (DTA) and Differential Scanning Calorimetry (DSC)
DTA reflects the endothermic or exothermic effects during thermal decomposition by comparing the temperature difference between the sample and an inert reference material (e.g., α-Al₂O₃); DSC directly quantifies the heat flow change and calculates the enthalpy change (ΔH) of the reaction. The combination of the two can determine the reaction type (endothermic/exothermic) and energy change magnitude of each decomposition stage, and assist in verifying the rationality of the stages divided by TGA. For example, the weak endothermic peak in the dehydration stage and the strong endothermic peak in the ligand degradation stage can correspond one-to-one with the mass loss steps in the TGA curve.
3. Hyphenated Techniques
To identify the specific composition of thermal decomposition products, thermal analysis is often combined with Gas Chromatography-Mass Spectrometry (TG-GC-MS) or Fourier Transform Infrared Spectroscopy (TG-FTIR). TG-GC-MS can capture the chromatographic peaks and mass spectra of volatile organic products (e.g., small-molecule acids, hydrocarbons) to achieve product qualitative and quantitative analysis; TG-FTIR tracks the generation process of gaseous products in real-time through characteristic infrared absorption peaks (e.g., 2349 cm⁻¹ for CO₂, 3400 cm⁻¹ for H₂O), providing direct evidence for the derivation of the reaction mechanism.
III. Kinetic Parameter Calculation and Model Fitting
The core goal of thermal decomposition kinetics research is to obtain the activation energy (Eₐ), pre-exponential factor (A), and reaction mechanism function (f(α) or g(α)). Common calculation methods can be divided into "model-fitting methods" and "model-free methods":
1. Model-Free Methods
This type of method does not require presetting a reaction mechanism and directly calculates the activation energy using TGA data at different heating rates, resulting in more objective results. It is currently the mainstream method, represented by the Ozawa-Flynn-Wall (OFW) method and the Kissinger-Akahira-Sunose (KAS) method.
Its core principle is based on the integral form of the Arrhenius equation. By linearly fitting the temperature (T) corresponding to the same conversion rate (α, usually 5%–90%) at different heating rates (β), a plot of lnβ (OFW method) or ln(β/T²) (KAS method) against 1/T is generated. The product of the absolute value of the slope and the gas constant (R) is the activation energy (Eₐ).
This method can obtain the activation energy change curve at different conversion rates: if Eₐ remains stable within a certain conversion rate range (fluctuation < 10%), it indicates that the reaction mechanism at this stage is single; if Eₐ changes significantly, it suggests a mechanism transition in the reaction (e.g., when transitioning from dehydration to ligand degradation, Eₐ increases from several tens of kJ/mol to over one hundred kJ/mol).
2. Model-Fitting Methods
This method requires presetting a reaction mechanism function (e.g., shrinking core model, nucleation and growth model, diffusion model, corresponding to different f(α) expressions). By fitting the experimental TGA data with the theoretical model curve, the model with the largest correlation coefficient (R²) and the smallest residual is selected as the optimal reaction mechanism, and the corresponding Eₐ and A are calculated.
For example, the dehydration stage of ferrous gluconate usually conforms to the "diffusion model" (e.g., D1 model, g(α)=α²), as water molecules need to diffuse through the crystal lattice to the surface; while the ligand degradation stage mostly conforms to the "nucleation and growth model" (e.g., A3 model, g(α)=[1-(1-α)^(1/3)]²), since the degradation reaction starts from the sample surface or internal defects and gradually expands to the core.
It should be noted that the results of this method depend on model selection and require cross-validation with the activation energy results from model-free methods to avoid deviations caused by a single model.
IV. Guiding Significance of Research Conclusions for Practical Applications
The conclusions of ferrous gluconate thermal decomposition kinetics research are not merely theoretical data but directly serve industrial production and product applications:
1. Production Process Optimization
Based on the activation energy (usually 30–50 kJ/mol) and initial decomposition temperature of the low-temperature dehydration stage, the safe temperature range for the drying process can be determined (e.g., controlled below 120°C), ensuring sufficient water removal while preventing premature degradation of gluconate. For subsequent formulation processing (e.g., tableting, coating), the upper limit of the processing temperature can also be set based on thermal stability data to prevent damage to the active ingredients of the product.
2. Formulation of Storage Conditions
The thermal aging life of ferrous gluconate at different temperatures can be predicted through kinetic parameters (e.g., calculating the half-life at room temperature based on the Arrhenius equation), guiding the design of storage conditions. For example, if research finds that the activation energy decreases significantly and the decomposition rate accelerates above 30°C, it is recommended that the product be stored in a cool place (<25°C) and isolated from humid environments to prevent moisture from promoting decomposition.
3. Product Stability Evaluation
By comparing the kinetic parameters of ferrous gluconate samples prepared by different processes (e.g., crystallization process, purity), the impact of the process on stability can be evaluated. For example, a high-purity sample has a higher activation energy in the ligand degradation stage (e.g., 150 kJ/mol vs 120 kJ/mol), indicating that improved purity can enhance thermal stability, providing a direction for process improvement.